
by Sara Elhawash
Health researchers often face challenges in data interpretation, especially when using network meta-analysis (NMA), which compares multiple treatments by combining various types of evidence from randomized trials. This complexity arises due to the numerous outcomes and interventions involved. To address this issue, the Data Sciences Institute (DSI)’s research software development support team collaborated with Dr. Areti-Angeliki Veroniki, a scientist at the Li Ka Shing Knowledge Institute at St. Michael’s Hospital, a site of Unity Health Toronto, to create a user-friendly web interface, the Rank-Heat Plot R Shiny tool. This tool allows health researchers to upload spreadsheets containing results of various medical treatments and compare outcomes through an easy-to-understand visualization tool.
DSI’s senior software developer Conor Klamann explains that the Rank-Heat Plot tool uses the “R Shiny framework to provide a user-friendly web interface, enabling users unfamiliar with R to analyze data and download results easily.”
“Working with the Data Sciences Institute has been transformative for our project. Their support enabled us to create the interface for the Rank-Heat Plot R Shiny tool, which has significantly simplified the way health researchers interpret complex network meta-analysis results. This user-friendly tool empowers researchers to make informed decisions and advance their understanding of various medical treatments, ultimately contributing to better patient care and outcomes,” says Dr. Veroniki.
DSI’s software development program offers faculty and scientists access to skilled developers who refine existing software, develop new tools and disseminate research software. “The Rank-Heat Plot project is hosted on a server provided free of charge by the Digital Research Alliance of Canada, making it a cost-effective option for researchers publishing small or moderately sized tools,” shares Conor.
Using the Rank-Heat Plot Tool
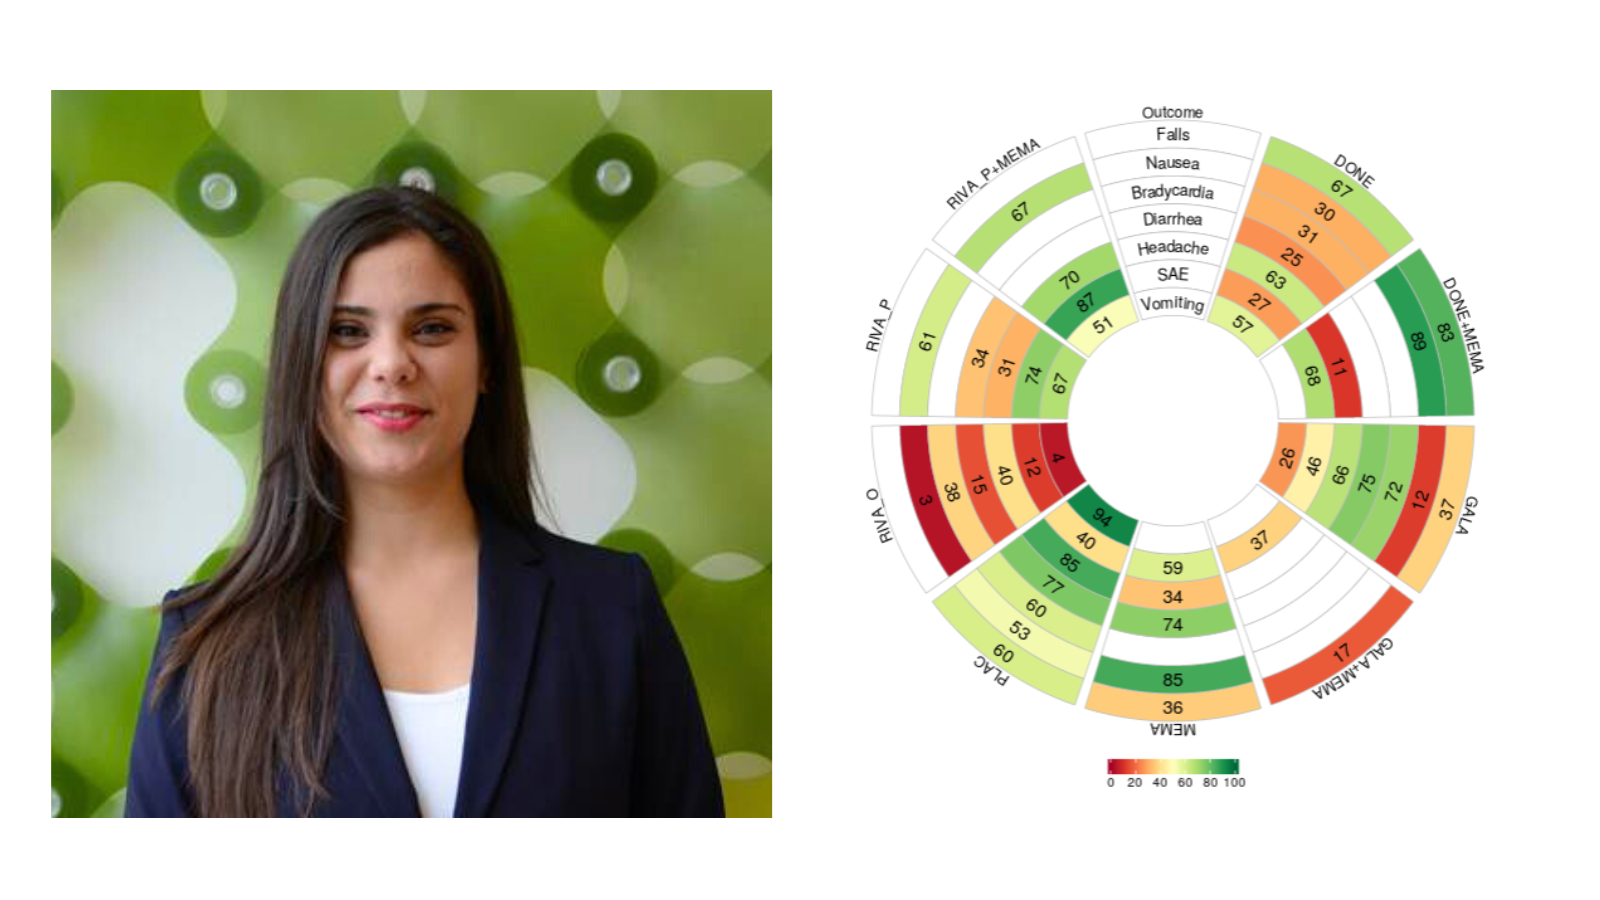
Users can upload data from multiple studies in a single excel file, select model specifications, and run the analysis. The tool then generates a rank heat plot, which can be customized and downloaded in high-quality PNG format. In protection of user privacy, no data is collected during this process.
Dr. Veroniki emphasizes the tool’s ability to quickly identify the most effective and safest interventions for various outcomes, as well as highlighting interventions that haven’t been studied for specific outcomes. She says, “The tool allows the conduction of multiple analyses and presentation of results in a very short timeframe, which can also be useful for users with limited or absence of knowledge in coding with R. The rank-heat plot can also be used for any discipline or disease, without any restrictions.”
Impact on Clinicians, Guideline Developers and Policymakers
Clinicians, guideline developers and policy makers can use the RankHeat Plot to make informed decisions about drug coverage, inform recommendations and discuss optimal agents across different outcomes with patients. The RankHeat Plot is expected to greatly benefit health researchers and improve their decision-making process.
Working alongside Dr. Veroniki is Professor Andrea Tricco from the Dalla Lana School of Public Health and a Scientist at St. Michael’s Hospital, a site of Unity Health Toronto, she emphasizes, “The rank heat plot allows all decision-makers to quickly identify which interventions are the safest and most effective across a range of outcomes. It is an essential component of our research and allows our results to be easily transferred to decision-makers.”
Dr. Veroniki and her team will be working with DSI on the upcoming version of the tool, stating, “We plan on developing the option to perform a Bayesian approach to be included and the ranking statistic results will be based on pre-specified clinically important effects.” She further explains, “This will facilitate interpretation of NMA results based on the smallest change in each outcome assessed, which is considered worthwhile and important by a patient and would mandate a change in the patient’s management.”
The Rank-Heat Plot has already been used in multiple fields, including falls prevention in older adults, dementia, cardiovascular risk reduction, COVID-19 vaccines, pediatrics, oncology and more. “The R Shiny tool’s accuracy, reliability, and user-friendly interface make it an invaluable asset to health researchers, improving their decision-making process and the quality of care they provide,” says Dr. Veroniki.